Customized Dashboards in ERPNext: Turning Business Data into Powerful Actionable Insights
Customized Dashboards in ERPNext help businesses transform operational data into meaningful, real-time insights. Instead of relying on static reports and spreadsheets, organizations can monitor sales, finance, projects, procurement, inventory, and executive KPIs through interactive dashboards tailored to each role. This enables faster decision-making, improved visibility, and greater operational efficiency.
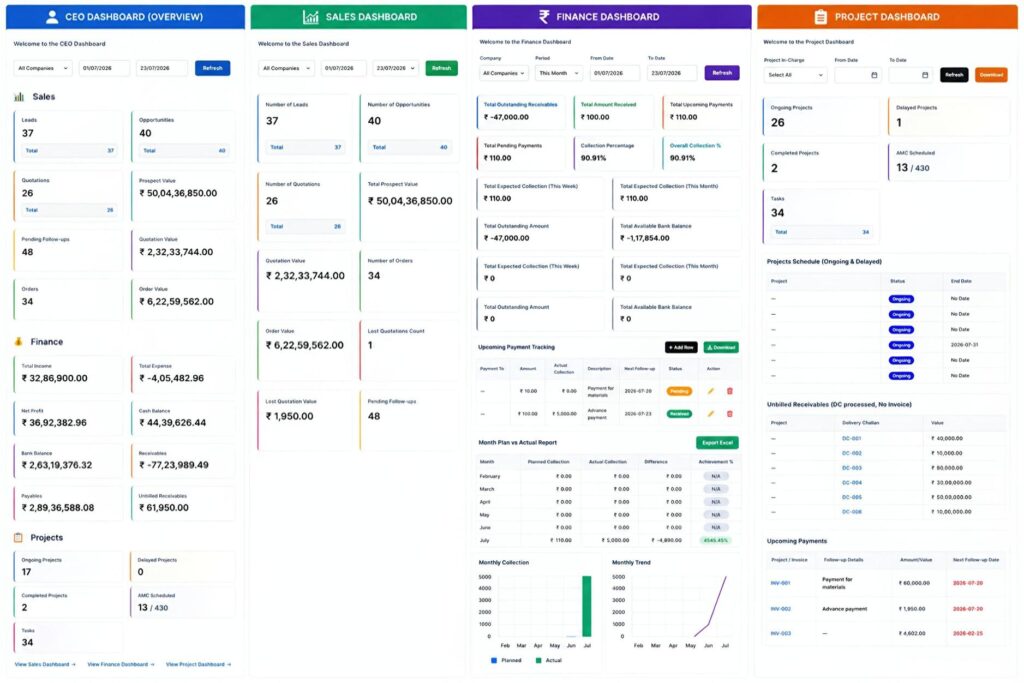
At KlyONIX Tech™, we customized Frappe ERPNext dashboards to provide role-based visibility, enabling users to monitor business performance, make informed decisions, and take action-all from a single screen.
Benefits of Customized Dashboards in ERPNext
Customized Dashboards in ERPNext help organizations improve operational visibility, reduce manual reporting, and enable proactive decision-making. With customizable widgets, drill-down analytics, and role-based access, businesses can monitor key performance indicators and respond quickly to changing business conditions.
Why Customized Dashboards in ERPNext Matter
Every business has unique processes and reporting requirements. While standard ERP dashboards provide general insights, customized dashboards focus on the metrics that matter most to your organization.
Our solution delivers:
- Role-based dashboards for different departments
- Real-time business insights
- Interactive, clickable widgets
- Powerful filters for company, date, and users
- Faster decision-making with minimal navigation
Project Dashboard
The Project Dashboard gives project managers complete visibility into ongoing operations and project performance.
Key Features
- Filter projects by Project In-Charge and date range.
- Track Ongoing, Delayed, Completed, and AMC Scheduled projects.
- Monitor project tasks with direct access to filtered task lists.
- View project schedules and completion status.
- Track Unbilled Receivables where Delivery Challans are created but invoices are still pending.
- Monitor Upcoming Customer Payments with follow-up details and expected collection dates.
- Export project data for reporting and analysis.
Business Benefits
- Better project monitoring
- Faster task tracking
- Improved billing visibility
- Timely payment follow-ups
- Increased operational efficiency
Sales Dashboard
The Sales Dashboard provides a complete overview of the sales pipeline from lead generation to order confirmation.
Key Features
- Multi-company selection with configurable date filters.
- Monitor Leads, Opportunities, Quotations, and Orders.
- Track Prospect Value, Quotation Value, and Order Value.
- Measure Lost Quotations by both count and value.
- Identify Pending Follow-ups for timely customer engagement.
- Interactive dashboard cards that open detailed records instantly.
Business Benefits
- Improved sales pipeline visibility
- Better conversion tracking
- Faster follow-up management
- Reduced quotation losses
- Data-driven sales decisions
Finance Dashboard
The Finance Dashboard centralizes financial performance into a single workspace for finance teams and management.
Key Features
- Filter reports by company, period, or custom date range.
- Monitor Outstanding Receivables and Amounts Received.
- Track Collection Percentage and Overall Collection Performance.
- View Available Bank Balance in real time.
- Manage Upcoming Payment Tracking with customer details, collection status, and follow-up dates.
- Compare Monthly Planned Collections with Actual Collections.
- Visual charts for Monthly Collection and Performance Trends.
- Export financial reports to Excel.
Business Benefits
- Improved cash flow management
- Better receivable tracking
- Higher collection efficiency
- Enhanced financial planning
- Clear visibility into payment performance
CEO Dashboard
The CEO Dashboard brings together the most important business metrics into a single executive view.
Instead of switching between multiple modules, decision-makers can monitor Sales, Finance, and Projects from one centralized dashboard.
Executive Highlights
Sales
- Leads
- Opportunities
- Quotations
- Orders
- Prospect Value
- Pending Follow-ups
Finance
- Income
- Expenses
- Net Profit
- Cash Balance
- Bank Balance
- Receivables
- Payables
- Unbilled Receivables
Projects
- Ongoing Projects
- Delayed Projects
- Completed Projects
- AMC Schedule Status
This unified dashboard enables leadership to identify trends, monitor business health, and make faster strategic decisions.
Interactive Dashboard Experience
Each dashboard widget is fully interactive.
Users can click on KPIs such as projects, tasks, quotations, receivables, or follow-ups to open filtered records instantly. This eliminates manual searching and significantly improves productivity.
Why Choose Customized Dashboards?
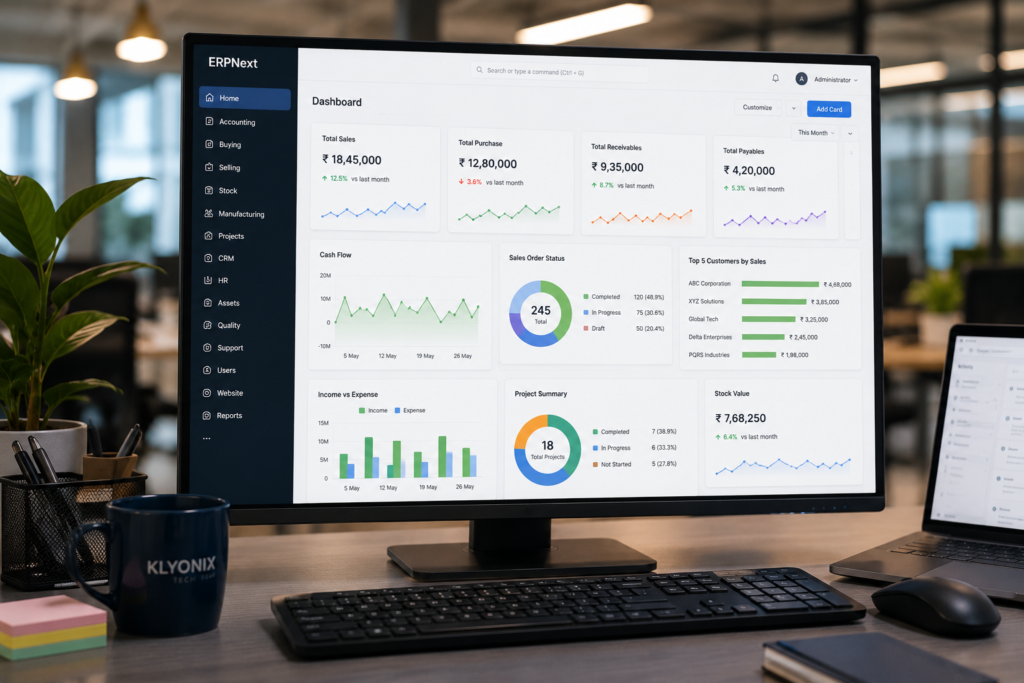
Customized dashboards transform ERPNext from a transaction management system into a powerful business intelligence platform.
With tailored dashboards, organizations can:
Improve operational visibility
Reduce manual reporting effort
Monitor KPIs in real time
Make faster business decisions
Learn more about ERPNext’s reporting and dashboard capabilities in the official ERPNext documentation.
While Customized Dashboards in ERPNext provide real-time visibility and decision-making capabilities, successful dashboard implementation depends on a well-planned ERP deployment. Learn more in our guide on ERPNext Implementation Cost: What It Actually Takes to Get It Right.
ERPNext Implementation Cost: 2026 Guide
Conclusion
Every organization has unique reporting needs. By customizing dashboards in Frappe ERPNext, businesses can access meaningful insights tailored to their operations rather than relying on generic reports.
At KlyONIX Tech™, we design role-based ERPNext dashboards that help project teams, sales departments, finance professionals, and business leaders work with greater clarity, efficiency, and confidence-turning business data into actionable insights that drive growth.